
I found a very useful article here: http://wooledge.org/~greg/sidfaq.html
The answered questions are the following:
1. What is sid?
2. What is unstable?
3. How do I install sid?
4. Does sid have package foo?
5. Is package foo broken?
6. How do I know what version of package foo I'm using?
7. When will package foo version bar be in sid?
8. But I need package foo version bar right now!
9. Can I use sid packages on stable?
10. Can I use sid packages on testing?
11. How do I backport a sid package to testing or stable?
12. Aren't there already backports...?
13. Should I use sid on my server?
14. Should I use sid on my desktop?
15. Does sid have security updates?
16. When is sid going to be released?
Εμφάνιση αναρτήσεων με ετικέτα english. Εμφάνιση όλων των αναρτήσεων
Εμφάνιση αναρτήσεων με ετικέτα english. Εμφάνιση όλων των αναρτήσεων
Πέμπτη 18 Δεκεμβρίου 2008


Τρίτη 9 Δεκεμβρίου 2008
Android on iPhone
It is confirmed that iPhone is able of running Linux. Maybe not as well as we could imagine, but it's all matter of time now.
The first thing that came in to my mind, was this picture:

I just can't wait for the moment an iPhone will boot android.
A very powerful mobile phone, running a very powerful OPEN SOURCE operating system.
Google's software running on Apple's hardware. Extraordinaire!
Resistance is futile ;)
http://elkosmas.gr/2008/11/29/iphone-linux-resistance-is-futile/
The first thing that came in to my mind, was this picture:

I just can't wait for the moment an iPhone will boot android.
A very powerful mobile phone, running a very powerful OPEN SOURCE operating system.
Google's software running on Apple's hardware. Extraordinaire!
Resistance is futile ;)
http://elkosmas.gr/2008/11/29/iphone-linux-resistance-is-futile/
Πέμπτη 4 Δεκεμβρίου 2008
Monitoring with munin
After reinstalling my whole system, I thought it would be nice to have a remote monitoring system.
So I set up munin on my vps. (cacti was my alternative option)
After a few days, I noticed something really strange at munin's logs.
These are the interesting pictures:


From your eyes there's nothing unusual. Except from one thing. At 00:00 on Thursday I was actually working on the pc for about an hour. This can be proved by the eth0 traffic.

What was happening the rest hours?
I was trying to figure out, why my pc uses the cpu when I am NOT using it.
It was very tricky, but after 2 minutes I was able to isolate the problem.
xscreensaver!
So I set up munin on my vps. (cacti was my alternative option)
After a few days, I noticed something really strange at munin's logs.
These are the interesting pictures:


From your eyes there's nothing unusual. Except from one thing. At 00:00 on Thursday I was actually working on the pc for about an hour. This can be proved by the eth0 traffic.

What was happening the rest hours?
I was trying to figure out, why my pc uses the cpu when I am NOT using it.
It was very tricky, but after 2 minutes I was able to isolate the problem.
xscreensaver!
Κυριακή 30 Νοεμβρίου 2008

Τρίτη 18 Νοεμβρίου 2008
Linux Taking Screenshots
Τετάρτη 12 Νοεμβρίου 2008
High resolution Terminal (tty)
To change the resolution of your tty's, just append the words "vga=XXX" to the kernel line of your /boot/grub/menu.lst
example:
If you want to go deeper, search for frame buffer
Thanks to Themis and Michalis
      colour          depth   | 640x480  800x600  1024x768 1280x1024
      256             (8bit)  |  769      771       773      775
      32000           (15bit) |  784      787       790      793
      65000           (16bit) |  785      788       791      794
      16.7 Mill.      (24bit) |  786      789       792      795
example:
cat /boot/grub/menu.lst
...
title Debian GNU/Linux, kernel 2.6.26-2-686
root (hd0,0)
kernel /boot/vmlinuz-2.6.26-2-686 root=/dev/sda1 ro vga=791
initrd /boot/initrd.img-2.6.26-2-686
...
If you want to go deeper, search for frame buffer
Thanks to Themis and Michalis
Δευτέρα 10 Νοεμβρίου 2008
My favorite Terminal Network monitoring tools
I would like to introduce some of my favorite network monitoring tools.
I will start with the 'simple as perfect' ifstat.
ifstat is "Report InterFace STATistics"
It lists all the network interfaces and displays the download and upload rates in a continuous stream. It can be scripted quite easily.
Similar to ifstat but with more options is bmon.
bmon is a "Portable bandwidth monitor and rate estimator"
It lists all the network interfaces and displays the current RX and TX rate.
It can show detailed statistics such as the errors, the total bytes the dropped packets etc.
Also it has a graphical statistics option.
Next on my list is iptraf.
iptraf is a "Interactive Colorful IP LAN Monitor"
It has a very nice text based menu and it can display lots of statistics about the interfaces.
It also has a IP traffic monitor showing the tcp and the udp connections.
Another powerful tool is iftop.
iftop can "display bandwidth usage on an interface by host"
and does exactly what is says. It displays the bandwidth usage of every host in a very nice graphical way.
This tool is very useful on a proxy server.
Last but not least, is ngrep and tcpdump.
Those tools are perfect for viewing and graping the network traffic.
They can be used with several filters.
For each one of the programs I described previously, there is a very nice man page you should try to read first before asking anything.
For graphical statistics collection tools, try ntop, munin and cacti. Each one suits different needs.
I will start with the 'simple as perfect' ifstat.
ifstat is "Report InterFace STATistics"
It lists all the network interfaces and displays the download and upload rates in a continuous stream. It can be scripted quite easily.
Similar to ifstat but with more options is bmon.
bmon is a "Portable bandwidth monitor and rate estimator"
It lists all the network interfaces and displays the current RX and TX rate.
It can show detailed statistics such as the errors, the total bytes the dropped packets etc.
Also it has a graphical statistics option.
Next on my list is iptraf.
iptraf is a "Interactive Colorful IP LAN Monitor"
It has a very nice text based menu and it can display lots of statistics about the interfaces.
It also has a IP traffic monitor showing the tcp and the udp connections.
Another powerful tool is iftop.
iftop can "display bandwidth usage on an interface by host"
and does exactly what is says. It displays the bandwidth usage of every host in a very nice graphical way.
This tool is very useful on a proxy server.
Last but not least, is ngrep and tcpdump.
Those tools are perfect for viewing and graping the network traffic.
They can be used with several filters.
For each one of the programs I described previously, there is a very nice man page you should try to read first before asking anything.
For graphical statistics collection tools, try ntop, munin and cacti. Each one suits different needs.
Δευτέρα 27 Οκτωβρίου 2008
Debian Vim syntax highlighting tip
To enable syntax highlighting in Vim, locate the file /etc/vim/vimrc.
Open it with your favorite editor and uncomment the syntax on line.
Open it with your favorite editor and uncomment the syntax on line.
Πέμπτη 23 Οκτωβρίου 2008
Linux Locking your screen with xtrlock

I have found the best program for locking your screen.
Install it with aptitude install xtrlock.
When you want to lock your screen just type xtrlock. you will be able to view the screen, move the mouse, but you will not be able to click or type anything.
To unlock the computer you just have to enter your password and press enter.
There are a lot of progs for doing this, but the cool thing I love the most about xtrlock, is that I am able to lock the screen through ssh :)
KDE 4 on Debian Lenny/Testing

If you want to install KDE 4 on Debian Lenny/Testing, go to http://kde4.debian.net/ and follow the simple instructions.
1. Add to your /etc/apt/sources.list file the following line:
deb http://kde4.debian.net/ lenny main
If you keep this line, packages will be updated every time there is a new release backported.
2. Run aptitude update
3. Install either:
- Minimal KDE 4 (kde4libs, kdepimlibs, kdebase-runtime, kdebase-workspace and kdebase) with
aptitude install kde4-minimal
then you can install just the KDE-modules you want - or full KDE 4 with
aptitude install kde4
Δευτέρα 13 Οκτωβρίου 2008
Linux Bluetooth tutorial

First of all, disconnect your usb bluetooth device from the usb port.
Run:
sudo tail -f /var/log/messages
and connect the usb device.You must see something like this:
kernel: usb 2-1: new full speed USB device using uhci_hcd and address 2
kernel: usb 2-1: configuration #1 chosen from 1 choice
kernel: Bluetooth: Core ver 2.11
kernel: NET: Registered protocol family 31
kernel: Bluetooth: HCI device and connection manager initialized
kernel: Bluetooth: HCI socket layer initialized
kernel: Bluetooth: HCI USB driver ver 2.9
kernel: usbcore: registered new interface driver hci_usb
kernel: Bluetooth: L2CAP ver 2.9
kernel: Bluetooth: L2CAP socket layer initialized
kernel: Bluetooth: RFCOMM socket layer initialized
kernel: Bluetooth: RFCOMM TTY layer initialized
kernel: Bluetooth: RFCOMM ver 1.8
That means that the kernel recognized your bluetooth usb device.
Now that you are ready to start, you have to install some programs to manage your bluetooth.
Run:
sudo aptitude install kdebluetooth
This will install a number of programs including:
kbluetooth - a bluetooth server for recieving files
kbtobexclient - a tool for sending files (OBEX)
kbluelock - a tool that locks the pc when a paired bluetooth device is not reachable
kbluemon - a tool for scanning devices and their services
In most cases, the bluetooth device is automatically recognized, but most of the users does not know the necessary programs to manage the bluetooth.
If your device is not automatically recognized, then search google for a kernel module (drivers)
Κυριακή 12 Οκτωβρίου 2008
Find the fastest repository!
There is a very nice tool for finding the fastest repository.
It downloads the mirror list from debian.org, then pings and traceroutes the servers to find which one is the fastest and finally it adds that mirror to your sources.list list.
So, aptitude install netselect-apt and then read the man.
For my system (I run debian testing and I want the non-free repositories) I use:
It downloads the mirror list from debian.org, then pings and traceroutes the servers to find which one is the fastest and finally it adds that mirror to your sources.list list.
So, aptitude install netselect-apt and then read the man.
For my system (I run debian testing and I want the non-free repositories) I use:
netselect-apt testing -n
Τρίτη 7 Οκτωβρίου 2008
My favorite Bug System
http://www.twbsd.org/enu/bug_tracker
What is Bug Tracker
Bug Tracker is a PHP web based bug tracking system. It helps you manage software development. It uses a database to store issues to be done, bugs to be fixed, and features to be added.
Most people are just like me, have limit bug-storing slot in their brains. It's easy to remember one or two issues. However, old issue will be swapped out when new one received. With a bug tracking system, bugs can be managed easier. All software development history can be stored in the database for future reference. Keeping a database of bugs is essential to a good software developing team.
Bug Tracker has two user interfaces. One is for internal developing team. The other is for customers or end users to report their feedback. It has flexible user/group permission management, database search/filter functions, FAQ and document management, and more.
Features
* VERY VERY VERY easy to install
* Easy to use
* Comprehensive permission system
* Email notice when report updated
* Customer feedback interface
* Anonymous feedback interface
* Search/filter on each field
* FAQ/Document management system
* System log, usage statistic
* UTF-8 support
* Multi-language user interface
* Upload attachment
* HTML editor in text area
* Support PostgreSQL and MySQL
* Support sending email through SMTP server that requires authentication
The Bug Tracker is a high performance application. It has been well tested. After tested its capacity on AMD 1G Hz CPU and 256 MB RAM machine running FreeBSD 5.3, we found that when there are 1000 users, 10000 anonymous users, 10000 reports, 10000 documents, and 10000 FAQ, the system is still very smooth.
What is Bug Tracker
Bug Tracker is a PHP web based bug tracking system. It helps you manage software development. It uses a database to store issues to be done, bugs to be fixed, and features to be added.
Most people are just like me, have limit bug-storing slot in their brains. It's easy to remember one or two issues. However, old issue will be swapped out when new one received. With a bug tracking system, bugs can be managed easier. All software development history can be stored in the database for future reference. Keeping a database of bugs is essential to a good software developing team.
Bug Tracker has two user interfaces. One is for internal developing team. The other is for customers or end users to report their feedback. It has flexible user/group permission management, database search/filter functions, FAQ and document management, and more.
Features
* VERY VERY VERY easy to install
* Easy to use
* Comprehensive permission system
* Email notice when report updated
* Customer feedback interface
* Anonymous feedback interface
* Search/filter on each field
* FAQ/Document management system
* System log, usage statistic
* UTF-8 support
* Multi-language user interface
* Upload attachment
* HTML editor in text area
* Support PostgreSQL and MySQL
* Support sending email through SMTP server that requires authentication
The Bug Tracker is a high performance application. It has been well tested. After tested its capacity on AMD 1G Hz CPU and 256 MB RAM machine running FreeBSD 5.3, we found that when there are 1000 users, 10000 anonymous users, 10000 reports, 10000 documents, and 10000 FAQ, the system is still very smooth.
Δευτέρα 6 Οκτωβρίου 2008
Running a threadless application on a Intel Core2 CPU
My processor:
I created a java app to test if a number is prime or not. It isn't very special, except the fact that you can check REALLY big numbers...
The result is this:

As you can see with htop, only one of the cores is executing the application.
Also, if you take a careful look at the xfce's cpu meter, the total use of the CPU counts a 50% percent.
After 25 minutes I guess 170141183460469231731687303715884105727 IS a big number to test:)
[BTW 170141183460469231731687303715884105727 is a prime, according to http://en.wikipedia.org/wiki/List_of_prime_numbers)
Edit: I resulted that 170141183460469231731687303715884105727 is NOT a prime... Bad work wikipedia!
You can check the code here: http://ventrix.nsdc.gr/code_folds/2008/10/07/java-prime-number/
$cat /proc/cpuinfo
ventrix@bytemobile:~$ cat /proc/cpuinfo
processor : 0
vendor_id : GenuineIntel
cpu family : 6
model : 15
model name : Intel(R) Core(TM)2 CPU 6300 @ 1.86GHz
stepping : 6
cpu MHz : 1875.766
cache size : 2048 KB
physical id : 0
siblings : 2
core id : 0
cpu cores : 2
I created a java app to test if a number is prime or not. It isn't very special, except the fact that you can check REALLY big numbers...
The result is this:

As you can see with htop, only one of the cores is executing the application.
Also, if you take a careful look at the xfce's cpu meter, the total use of the CPU counts a 50% percent.
After 25 minutes I guess 170141183460469231731687303715884105727 IS a big number to test:)
[BTW 170141183460469231731687303715884105727 is a prime, according to http://en.wikipedia.org/wiki/List_of_prime_numbers)
Edit: I resulted that 170141183460469231731687303715884105727 is NOT a prime... Bad work wikipedia!
You can check the code here: http://ventrix.nsdc.gr/code_folds/2008/10/07/java-prime-number/
Σάββατο 4 Οκτωβρίου 2008
Linux distro comparison
Linux distro comparison:
If you want to compare two linux distro, this would be the perect site for you: http://polishlinux.org/choose/comparison/
If you want to compare two linux distro, this would be the perect site for you: http://polishlinux.org/choose/comparison/
Δευτέρα 15 Σεπτεμβρίου 2008
Linux remote files as local folder via ssh
If you have ssh access to a pc, you can work with it's files as working on your local files with Konqueror.
Open Konqueror and write:
Open Konqueror and write:
fish://username@ip_or_hostname
Linux always on time

To keep your clock on the right time, you need ntpdate.
Install it and find an ntp server.
Then run it with
ntpdate ntp.exampleserver.com
A quick list of greek ntp servers:
ntp.mfa.gr, ntp.grnet.gr, gr.pool.ntp.org (pool of servers)
Παρασκευή 12 Σεπτεμβρίου 2008
Linux log files
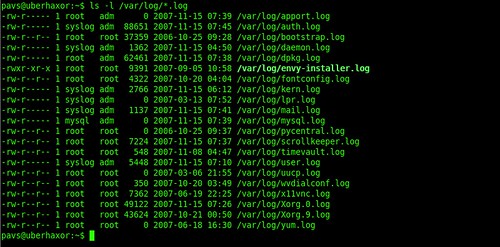
There is a specific program where you can check the boot messages: dmesg
There are also some specific files keeping logs which are:
* /var/log/message: General message and system related stuff
* /var/log/auth.log: Authenication logs
* /var/log/kern.log: Kernel logs
* /var/log/cron.log: Crond logs (cron job)
* /var/log/maillog: Mail server logs
* /var/log/httpd/: Apache access and error logs directory
* /var/log/lighttpd: Lighttpd access and error logs directory
* /var/log/boot.log : System boot log
* /var/log/mysqld.log: MySQL database server log file
* /var/log/secure: Authentication log
* /var/log/utmp or /var/log/wtmp : Login records file
* /var/log/yum.log: Yum log files
* /var/log/qmail/ : Qmail log directory (more files inside this directory)
Some of them may need root privileges to be viewed.
Of course, here I do not list all the deamons as each one may have his own file or directory.
They can be combined with the tail -f command witch outputs appended data as the log file grows.
sudo tail -f /var/log/auth.log | grep 'authentication failure' >> auth_fail.log
for example saves all the authentication failures to the auth_fail.log file.Your Imagination is the only Limitation
Πέμπτη 11 Σεπτεμβρίου 2008
RAID with Intel Corporation 82801GR/GH (ICH7 Family) SATA RAID Controller
RAID with Intel Corporation 82801GR/GH (ICH7 Family) SATA RAID Controller
First of all you have to install dmraid with
Then load the necessary module, dm_mod with
If you want your system to automatically load the module just edit the /etc/modules file with
You should find your raid disk under /dev/mapper/ as "isw_abc*"
Then create a directory under /media (or wherever else you like) with
Mount your disk with
Then go to /media/raiddisk and you should see your files!
First of all you have to install dmraid with
sudo aptitude install dmraid
.Then load the necessary module, dm_mod with
sudo modprobe dm_mod
.If you want your system to automatically load the module just edit the /etc/modules file with
sudo gedit /etc/modules
and add a new line with the name of the module you want to auto start, in this case "dm_mod".You should find your raid disk under /dev/mapper/ as "isw_abc*"
Then create a directory under /media (or wherever else you like) with
sudo mkdir /media/raiddisk
.Mount your disk with
sudo mount -t auto /dev/mapper/isw[your_disk] /media/raiddisk
. (if you want this to be done automatically then try /etc/fstab)Then go to /media/raiddisk and you should see your files!
Δευτέρα 1 Σεπτεμβρίου 2008
Install Debian with gui

If you want to install Debian with a GUI instead of the the standard text mode just write "installgui" at the bootscreen

Εγγραφή σε:
Αναρτήσεις (Atom)




 Αναρτήσεις

